09 · Metrics
PR Curves and AUPRC
A legitimate preference for high-scoring mistakes, and a terrible imbalance correction.
If there is one piece of received advice this tutorial exists to argue with, it is this one: your data is imbalanced, so use the precision-recall curve instead of the ROC curve. It appears in textbooks, in library documentation, and in several hundred published papers.
AUPRC is a perfectly reasonable metric that measures something real. It is simply not the thing it is famous for measuring.
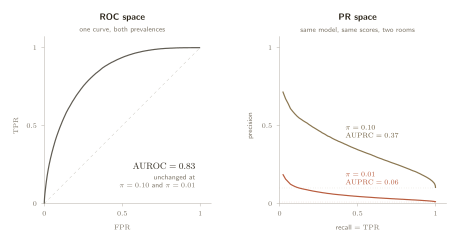
ROC space with a prevalence bolted on
The construction is the same sweep as before, plotted against a different vertical axis.
Recall on the horizontal axis, precision on the vertical. And section 05 already told us what precision is made of.
Substitute that in and the relationship is not a rivalry at all. The horizontal axis is a ROC axis. The vertical axis is a function of both ROC axes and
One consequence arrives immediately. A model scoring at random sits at
What the two metrics actually differ by
If AUPRC is not a corrected AUROC, what is the difference between them? McDermott et al. answer it exactly, with a pair of identities (McDermott et al., 2024).
Both average the false positive rate over thresholds drawn from the positive scores. They differ in exactly two places, and it is worth separating them because they are separate things.
- A prevalence factor,
- A weight inside the expectation,
The second point is the interesting one, and it has a sharp consequence. Their Theorem 2: take any single adjacent pair of instances that the model has ranked the wrong way round, and fix it. AUROC improves by the same amount regardless of which mistake you chose. AUPRC improves more the higher up the score axis the fix sits.
So AUPRC is not a bias-corrected AUROC. It is AUROC with a stated preference for getting the top of the ranking right, which is a completely respectable thing to want, and is precisely what section 08 obtained by a different and more controllable route.
The correction that cannot be made
Granting that AUPRC moves with prevalence, the natural next thought is to divide the dependence out. The chance level is
| Attempted repair | ||
|---|---|---|
| raw | ||
| minus the baseline | ||
| divided by the baseline | ||
| rescaled to | ||
Not one of the three lands on the same value twice, and the fold-change repair does not even move in the right direction: it reports the model as substantially better at the lower prevalence.
The reason is structural rather than a failure of ingenuity. These repairs assume the AUPRC-versus-prevalence relationship has a fixed shape that can be divided away. It does not, because the shape depends on the classifier, through the firing-rate weighting in the identity above. A correction that works for one model will not work for the next, and the whole point of a metric is to compare them.
Who the weighting favours
The firing-rate weighting has a consequence that is not obvious and is not benign. Suppose the evaluation population contains two subgroups with different base rates, which is the normal condition of almost any real dataset.
McDermott et al.'s Theorem 3: as one subgroup's prevalence goes to zero, the single ranking mistake whose correction most improves AUPRC lies entirely within the other, higher-prevalence subgroup, with probability tending to one (McDermott et al., 2024).
The mechanism follows from what we already have. AUPRC rewards fixes high on the score axis, and cases from a very rare subgroup almost never appear high on the score axis, precisely because they are rare. Selecting models by AUPRC therefore concentrates improvement where the positives already are, and the group with the fewest positives is the one that gets optimised last. The metric most often recommended for rare classes quietly deprioritises the rarest.
Three limits are worth stating, because the authors state them. The theorem assumes the low-prevalence subgroup is perfectly calibrated, which they call their largest limitation. It is asymptotic, a statement about the limit as prevalence goes to zero, not a bound at any finite prevalence. And their real-data effect is much weaker than their synthetic one, because real subgroup prevalence ratios in their datasets only reach
Where the belief came from
Given all of the above, it is worth asking why the advice is so universal. McDermott et al. went and looked. Across a corpus of over 1.5 million papers they found
The original remark was an intuition about false positive counts moving more visibly in PR space than in ROC space, offered without proof. It was then cited, and the citations were cited, until it became something everyone knows.
When to use it anyway
None of this makes AUPRC a bad metric. It makes it a metric about something other than imbalance. Two conditions justify it.
- Mistakes near the top of the ranking genuinely cost more than mistakes further down, which is the ordinary situation whenever a person works a queue from the top.
- The evaluation prevalence is the deployment prevalence, or is declared alongside the number, exactly as section 05 required for precision.
Under both, AUPRC summarises the top of a ranking at a stated base rate, and does it well. Outside them it is reporting a mixture of the model, the population and an implicit weighting, with no way to separate the three.
It is worth putting side by side with the previous section, because the two want the same thing and one of them asks for it out loud.
| Prefers the top of the ranking | yes, by a stated cutoff | yes, by an implicit weight |
| Moves with the class mix | no | yes, and it cannot be removed |
| The preference is | chosen by you, from a budget | chosen by the model's score distribution |
Every section since 03 has ended in the same place, and the repetition is the argument. A metric encodes a preference about mistakes; the only question is whether anybody wrote it down.
Sections 03 to 09 have all been claims about expectations, about where numbers sit on average. The next section asks a question none of the three papers ask: at one percent prevalence, with forty positives in the test set, how much of what we just measured is real?