02 · Metrics
TPR and FPR
Why evaluating ratios strictly within class boundaries defines the entire evaluation mechanism.
The previous section ended on a complaint. Accuracy moves when the crowd moves, and once it has moved there is no way to recover how much of the number belonged to the model.
That complaint has a possible solution to it: split the cases by their true label first, then score each group on its own terms.
Ask how often the positive cases are caught. Ask, separately, how often the negative cases are wrongly flagged. Neither question mentions the other class, so neither answer can be shifted by recruiting more of the opposite class.
Conditioning on the truth
The previous section built a prediction out of a score and a threshold, where
And accuracy asked how often
The vertical bar (
Now look for
Where the prevalence went
Accuracy did not lose the prevalence. It absorbed it. Split the population by label, and the accuracy of any threshold rule can be written out in full:
Every one of the three settlements is now visible in a single line.
The identity also explains the grids from the previous section without any new work. A model that answers negative to everything has
The pair
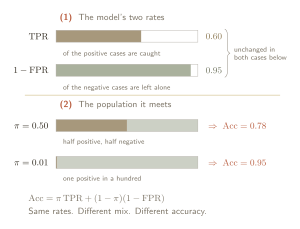
The denominator decides
None of that was special to these two rates. The invariance came from something structural, and the same structure settles the question for every metric in this tutorial.
A threshold rule sorts every case into one of four boxes. Each case arrives with a true label,
There are two ways to group those four boxes. Group them by column and each group is a class: everyone who really was positive, everyone who really was negative. Group them by row and each group is a decision: everything the model flagged, everything it let through. A column holds one class. A row holds both.
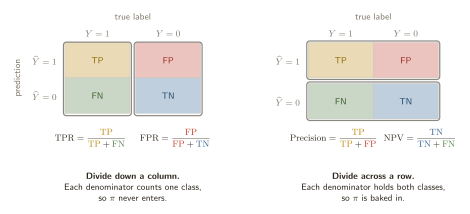
Precision divides by a row total, and a row holds cases from both classes. Of everything the model flagged, what share really was positive? Adding negatives to the population adds them to that row, which changes the denominator without the model doing anything differently.
The other row has a name too. Of everything the model let through, the share that really was negative is the negative predictive value (NPV), and it is precision's mirror image.
A later section takes precision up properly. For now it is enough to see that both of them sit on the other axis.
What the pair leaves open
Three things were settled back in the first section: a prevalence, a cost, and a threshold. Conditioning on the truth deals with the prevalence. The other two are exactly where they were.
Two numbers do not rank models
Consider two models on the same screening problem.
- Model A catches
- Model B catches
Which model is better?
Nothing in the two pairs of numbers answers that. Model A catches more disease and generates a great deal more alarm. On the other hand, model B is quieter and misses more. Neither dominates the other, and no amount of staring and reflecting about
Any rule that does produce a winner should say how much a missed case costs relative to a false alarm.
Prevalence was removed from the arithmetic; cost was not, and ideally shouldn't be, because ranking two models is a decision and decisions inevitably need costs.
The threshold never left
The third settlement is still in place, and the notation has been saying so all along. Both rates were written
That is not a flaw to be engineered away. It is the opening for the next idea. If a single threshold gives a single pair, then sweeping the threshold across its whole range gives a curve, and a curve describes the model without committing to any operating point at all.
Two ways a population can change
A population can change in quite different ways, let me highlight two:
- The mix changes. More negatives arrive, and they look like the negatives already there. Their scores fall in the same places.
- The cases themselves change. More negatives arrive, and they are a different sort of person. Their scores sit somewhere else entirely.
Everything on this page so far has been about the first kind. There, the argument holds exactly:
The second kind breaks it because suppose in the clinical example that the extra healthy patients are recruited from a workplace screening programme rather than from the clinic waiting room. They are younger and have no symptoms, so the model scores them lower than the negatives it was tested on. Fewer of them cross the threshold, and
The invariance is a claim about the mix, not about the population. It says the rates survive a change in "how many". It does not say they survive a change in "who" (Richardson et al., 2024).