Built by
Metrics
- IG Igor Lima @igor17400 10 page
Every merged contribution is typed and scored at review. Chips next to a heading show who touched that section. Scores feed the contributor share of project support.
01 · Metrics
What a Metric Actually Is
An estimator of a population quantity, paired with an unacknowledged design choice.
Arguably, one of the most important parts of a learning system is judging whether the system has, actually, learned. Every time I study a new topic I struggle with the same thing: knowing whether I have really understood it. One of my high school mathematics teachers used to say that the more you study mathematics, the more you realise how little you know. That thought stayed with me. This is not a discussion about what intelligence is, or anything close to AGI, but the question survives at a much smaller scale:
How do we know that the simple model we just trained has learned anything at all?
There is a great deal of mathematics behind that question. I am not a mathematician, so this section skips most of it and keeps one distinction. Every evaluation number is two things at once:
- It is an estimator. The test set is a sample, not the world, so the number that comes out of it is a guess. Every guess comes with error.
- It is a decision. Before a single prediction is scored, the formula has already chosen which mistakes count as bad, how common the positive class is, and where to draw the line.
The first (estimator) is usually acknowledged, if only by a confidence interval. The second (decision) sometimes it is not, because it does not appear in the reported number. This tutorial pulls the two apart, one metric at a time, asking of each what does it estimate, when is that the quantity of interest, and what breaks when it is not.
- The second object is what came out of the test set. This is the estimate.
- Count the correct predictions, divide by the number of examples, report 0.94.
- That number is a random variable.
- Draw a different test set from the same distribution and it lands somewhere else.
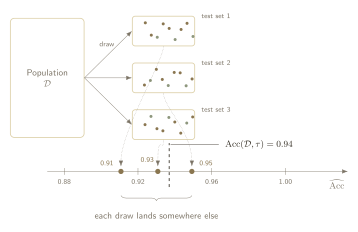
Every complaint about a metric is a complaint about one of the two, let's dive further into this.
- "Accuracy was 0.94 on the test set and 0.71 once the model was deployed." → a claim about an estimand.
- If this model is deployed into a medical clinic the scenario there is not the test set. Patients arrive at a different rate, so 0.71 is a correct measurement of a different number.
- A larger clinical set perhaps would still have said 0.94.
- "Accuracy was 0.94 on this split and 0.89 on the next one." → a claim about an estimate.
- Nothing about the world changed between the two runs. The same population was sampled twice and returned two different answers.
- A larger test set would have brought them closer together.
The phrase "metrics are unreliable under class imbalance" collapses both into a single complaint. A target that moves needs a different remedy from a measurement that is noisy, and the phrase hides which of the two is at hand.
The decision hiding in the formula
Let's now imagine that everything the previous section asked for is granted: the test set is enormous, the sampling error has vanished, and 0.94 is the estimand itself, known exactly.
Is that enough?
No. The number says how often the model was right. It does not say what right was taken to mean, and that was settled before a single prediction was scored.
Perhaps this is still a bit abstract, so let's break it down and take the two settlements one at a time.
Settlement one: where to draw the line
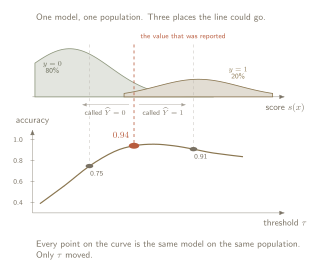
Accuracy is computed from predictions, but a model does not produce predictions. It produces
That threshold may have been tuned with great care, or inherited from whatever the surrounding code happened to do for example
So 0.94 is not the accuracy of the model. It is the accuracy of the model at one point on a curve, and the curve was never shown.
Settlement two: what a mistake is worth
There are two ways to be wrong. The model can call a negative case positive, or it can call a positive case negative. Accuracy counts both, adds them together, and divides. Each one costs exactly the same and we can say something like "one unit of wrongness".
That is not a fact about the model. It is a claim about the world, and a strong one. In a screening programme it says that missing a cancer and sending a healthy person for an unnecessary scan are equally bad outcomes. Written out as a sentence, that is a claim most people would reject on sight. Written as a metric, it goes unintuitively unchecked.
The two settlements are also not independent. Call
Equal costs put that break-even point at one half. So the familiar
Settlement three: who is in the room
Accuracy asks how often the model is right. Right about whom, though?
Every case in the test set gets exactly one vote, so the answer belongs to whichever class brought the most cases. In a population that is eighty percent negative, the negatives cast eighty percent of the votes, and the accuracy is mostly a report on how well the model handles them.
Hold
Push the recruiting far enough and the arithmetic turns absurd. Take a population that is ninety-nine percent negative, so
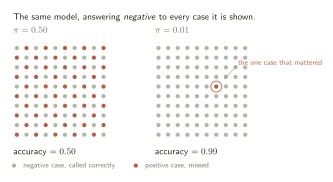
The usual conclusion drawn from that example is that accuracy is broken. This expression might be a bit much and it is worth resisting.
Accuracy answered exactly the question it was asked. That is, on this population, at this threshold, counting both mistakes the same, how often is the model right? The answer is
This also settles a debt from earlier. Accuracy was
Which leaves the settlement itself: a number that moves with the crowd is partly reporting the crowd. Accuracy tells us something about the model and something about the population at the same time, added together, with no way to pull the two apart.
What a defensible number states
Three different things went wrong across this page, and the rest of the tutorial depends on keeping them apart. They look alike from a distance and they have nothing in common up close.
- The estimand moved. The clinic was not the test set, so
- The estimate scattered. Three test sets drawn from one population returned
- The settlements went unexamined. A threshold, a cost, and a prevalence were fixed before any prediction was scored. No quantity of data touches this, and neither does a better model.
Only the third is a criticism of the metric, and even then it is a gentle one. Each settlement is a problem because it was made in silence, not because it was made at all. Somebody has to decide these things. Written down, all three are ordinary engineering decisions:
- the prevalence the model will meet where it is deployed,
- what each kind of mistake costs,
- and where the threshold sits, given the first two.
A number reported next to those three is a claim that can be checked, argued with, and acted on. A number reported alone is a claim about a population, a cost structure, and an operating point that nobody wrote down.
Every section that follows does the same thing to a different metric. It asks which of the three that metric hands over, and which it decides on its own.