07 · Metrics
ROC and AUROC
Invariance is not neutrality. It is a prior over deployment prevalence, chosen by the model.
Every metric in the last four sections picked a threshold and reported what happened there. Each picked a different one, and none of them said so. The obvious escape is to stop picking.
This is the pivot of the tutorial, and it needs two readings held at once. One says the resulting number is the only honest thing here. The other says it is the most deceptive. Both are correct, and they are answers to different questions.
The curve
Section 02 ended with the observation that a single threshold gives a single pair of rates, so sweeping the threshold gives a curve. That curve is the Receiver Operating Characteristic (ROC).
Read the definition for what is missing. Both coordinates are column ratios, so no prevalence appears anywhere on either axis, and
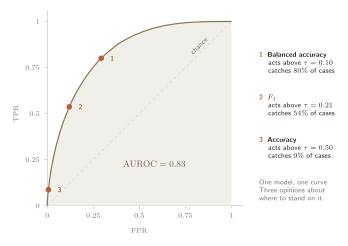
Where those three thresholds came from
Each was derived in an earlier section, and the model in the figure is a single fixed one, so the three rules can be applied to it and compared directly.
| Metric | Rule | Here | Fixed by |
|---|---|---|---|
| Accuracy | nothing. It is the same constant on every problem. | ||
| Balanced accuracy | the evaluation set, through its base rate. | ||
| the model, through the score it manages to attain. |
Those three numbers fall in the order
The area, and what it means
To systematically compare models across their operating range, we calculate the area under their ROC curves (AUROC). The interesting part is that this geometric area is exactly equal to a specific ranking probability:
where
McDermott et al. give a second form that makes the structure explicit (McDermott et al., 2024).
Think of this as a step-by-step procedure. Take a positive case, use its score as a threshold, and record the false positive rate at that exact point. Average that result across all positive cases. Here's one of the most interesting parts to this. Every false positive is penalized equally, no matter where it sits on the score distribution, because the expectation is unweighted.
The invariance
Neither of the forms above contains the prevalence
Richardson et al. demonstrate exactly this by simulation, holding the class-conditional score distributions fixed and varying the ratio across
What the invariance costs
Now the other reading. Flores et al. prove that for a calibrated score, AUROC is not threshold-free at all. It is an average of threshold decisions (Flores et al., 2025).
The inner term, the prior-adjusted maximum net benefit (PAMNB), quantifies the model's payoff on a population with prevalence
But that raises a question: how is that average weighted? The equation's subscript gives it away. The averaging distribution,
Ok... that's probably not clear. Let's try to make it easier. If we have a screening problem where the true prevalence is somewhere between
Holding both readings
The two papers agree completely on the mathematics and disagree entirely on what it is worth. It is worth being precise about why, because it is not a dispute that resolves.
| Question | Verdict on the invariance |
|---|---|
| Does the number move when I change the class mix on a fixed population? | A virtue. It does not, and it should not, because the model did not change. (Richardson) |
| Which decision, at which deployment prevalence, does this number correspond to? | A defect. Invariance means the metric refuses to let you state the prevalence you actually face. (Flores) |
Both are right. A metric that does not move when we resample the negatives is measuring the model. A metric that cannot be told what prevalence it will deploy at is not answering a decision question. Invariance and neutrality are not the same thing. AUROC has an opinion about deployment prevalence. Its opinion is all of them, weighted by its own score histogram.
Two conditions worth naming
The class-conditional score distributions must be fixed. Adding negatives identical to the existing distribution preserves the AUROC. However, real-world prevalence shifts often introduce out-of-distribution negatives. As Richardson et al. demonstrate (Richardson et al., 2024), enriching a dataset with novel, low-scoring negatives alters the underlying score distribution and forces the AUROC to shift.
Scores must be calibrated. Flores's interpretation of AUROC as an averaged net benefit strictly requires calibrated scores. If scores are uncalibrated, the metric remains purely a measure of ordinal ranking. AUROC only translates decision-theoretic insights when the score values carry reliably probabilistic meaning.