learning-ai.cafe learning-ai.cafe / Metrics / 08

08 · Metrics

Partial AUROC

Caring about the top of the ranking without leaving ROC space.

AUROC averages over every threshold, giving each the same weight. That is the right thing to do when every threshold is a live possibility. Very often none of them are.

Most of the curve is unreachable

Richardson et al. give the motivating case. A drug discovery campaign screens candidate antibodies and can afford to synthesise and test of them (Richardson et al., 2024). The model ranks the candidates, the top hundred get made, and every other point on the ROC curve describes an experiment nobody will run.

The pattern is everywhere once you look. A radiologist can review forty flagged scans a day. A fraud team can call three hundred customers. A hiring pipeline can interview twelve people. The capacity to act is fixed and small, and it fixes where on the curve you will stand, long before any model is trained.

Under that constraint, AUROC is answering a question with the wrong scope. Half its integral covers the region past , where the model flags the majority of healthy people, and no budget survives contact with that.

Integrate less of it

The repair is to stop integrating where you cannot go. Pick a ceiling on the false positive rate and take the area only up to it.

This is not yet comparable to anything. Its range depends on : a model ranking at random earns , and a perfect one earns , so for every possible value is squeezed between and . That is section 03's collapsing scale, in a new costume.

The McClish correction rescales the interval so the familiar anchors come back.

Random scores now give and a perfect ranking gives , exactly as with full AUROC, so the two live on the same scale and a reader knows what means. In scikit-learn this is roc_auc_score(y, s, max_fpr=0.1), which applies the correction (Richardson et al., 2024).

What survives the restriction

Everything section 07 established. is built from and and nothing else, both divide by column totals, so restricting the range does not reintroduce prevalence. The metric expresses a preference for the top of the ranking while remaining invariant to the class mix.

When one number hides two models

The restriction is not a cosmetic adjustment. Two models can have identical AUROC and behave completely differently in the only region you can reach.
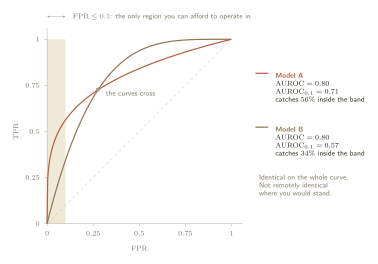
Two ROC curves on the same axes, both with area 0.80, crossing at a false positive rate of about 0.28. A shaded vertical band marks the region below false positive rate 0.1. Inside that band Model A rises far more steeply, reaching a true positive rate of 0.56 while Model B reaches only 0.34. A legend gives both models AUROC 0.80, with corrected partial AUROC of 0.71 for A and 0.57 for B.

Two models, both scoring . Inside the affordable band, model A catches of the positives and model B catches . Corrected to the same scale that is against . A single summary number reported these two as equals, and on the only stretch of curve anybody can use, one of them finds two thirds again as much as the other.

What makes the example possible is that the curves cross, and that deserves a second look, because there is an objection lurking in it. Richardson et al. repeat Fawcett's warning that areas should not be compared when the underlying curves cross, since the summary is then averaging over a reversal (Richardson et al., 2024). We have just compared two areas.

The warning lands on the full-range number, not the restricted one. Across the whole curve, for both models, and that equality is a truce: a stretch where A is better traded against a stretch where B is. Averaging the two into one figure is exactly the thing Fawcett says not to do, and it is what the reported equality did.

The restricted comparison is safe for a specific reason. The crossing sits at , which is outside the band. Inside the two curves never meet and model A is above model B at every point, so the partial areas are summarising an agreement rather than papering over a disagreement.

Which gives a rule worth carrying: compare areas only over a range on which one curve dominates the other throughout. Choosing that range by what you can afford to do will often hand you the condition for free, and when it does not, the curves crossing inside your own operating band is itself the finding.

Where has to come from

Richardson et al. recommend . That value comes from B cell and T cell epitope prediction, where it is conventional, and the paper presents it as general guidance (Richardson et al., 2024). The same paper elsewhere criticises a competing method for fixing a parameter that ought to depend on the data, and the objection applies to their own choice with equal force. Inheriting because a paper used it is the same mistake as inheriting because the library defaulted to it.

Fortunately can be derived rather than borrowed. A ceiling on is a ceiling on the number of false positives, since . If the negative class has cases and you can act on of them in total, then

For the antibody campaign, out of roughly negatives, so , which is a hundred times stricter than the recommended convention. For the radiologist reviewing forty scans a day out of two thousand, . Neither number is a matter of taste. Both are read off a schedule.

It is worth naming what just happened, because the rest of the tutorial builds on it. A capacity constraint is a cost statement wearing work clothes. Saying that you can afford a hundred experiments is saying something about what a wasted experiment costs relative to a missed discovery. Partial AUROC lets that enter the metric, but only through a single blunt instrument, a hard ceiling, with everything below the ceiling still weighted equally.

Section 14 does the same job properly, with a cost ratio instead of a cutoff. Before that, section 09 takes the other route out of the ROC curve, and shows what happens when the preference for the top of the ranking is expressed implicitly instead.

learning-ai.cafe

Metrics

Leaving out parts of the truth: an analysis of metric estimation, theoretical assumptions, and points of structural failure in ML/DL.

  1. 01 What a Metric Actually Is
  2. 02 TPR and FPR
  3. 03 Accuracy
  4. 04 Balanced Accuracy
  5. 05 Precision
  6. 06 F1
  7. 07 ROC and AUROC
  8. 08 Partial AUROC
    1. Most of the curve is unreachable
    2. Integrate less of it
    3. When one number hides two models
    4. Where has to come from
  9. 09 PR Curves and AUPRC
  10. 10 Variance at Low Prevalence
  11. 11 Calibration and ECE
  12. 12 Brier Score
  13. 13 Log Score
  14. 14 Net Benefit
  15. 15 Bounded DCA Log Score
  16. 16 What to Report
  17. 17 References

Who built this page

Every merged contribution is typed and scored at review. Chips next to a heading show who touched that section. Scores feed the contributor share of project support.

History

    Propose a change

    Settings

    Language
    Appearance
    Accent
    Font
    Text size
    Column width
    Book